Workshop for the DLA Conference 2013 6-8 June Bernberg, Germany.
http://www.kolleg.loel.hs-anhalt.de/landschaftsinformatik/dla-conference.html

Nadia Amoroso, DataAppeal, Andrew Hudson-Smith, University College London, Mike Phillips, Plymouth University, Chris Speed, University of Edinburgh & Katharine Willis, Plymouth University.
Abstract
(Latour 2005:242)
The Patch-Scape workshop offers a challenging but playful opportunity for participants to generate spatial, social and environmental data derived from the landscape and manage it’s transposition into a series of representational modes using digital technology. Using the Patch-Scape Digital Switchboard, the workshop explores the potential to transpose different data sets into a different 2D and 3D forms.
This paper introduces the strategies, methods and technologies behind the workshop and offers a critical toolkit toward developing trans-media processes for manifesting digital architectures.
Introduction
The development of tools for representing, modeling and visualising the natural landscape has tended to focus on either representing information through GIS-based tools, or enabling more realistic visualisations of virtual models. According to Harvey et al. (2008) representations are both supported by and contribute to models which provide the set of constructs for describing and representing parts of the real world digitally (Longley et al 2006), whereas ‘visualisations’ offer a flexible medium for analysing and interacting with real and artificially created environments (MacEachren et al 2001). More recently supporting participatory approaches have explored the potential for user-generated approaches, such as the ‘geospatial web’ or ‘geoweb’ which enables users ‘to navigate, access, and visualize geo-referenced data as they would in a physical world’ (Leclerlc et al 2001). The possibilities offered by mapping and mashup formats developed from the geospatial web in conjunction with mobile computing are also inspiring new metaphors for collaborative mapping and the description of experiences in geographic spaces. For example, mobility data (Ratti et al 2006) and sensor data (Burkey et al 2006) are increasingly used to obtain different kinds of ‘geovisualizations’ (Giaccardi and Foggli 2008). This shift sees users not only choosing how the landscape is represented but increasingly responsible for the data gathering that become part of the ecology (Turner et al. 2001) of the landscape information.
Instead of being passive viewers of the represented landscape, they become instrumental in how the changing landscape is interpreted. This acknowledges an anthropological approach to landscape, such as that outlined by Ingold, who claims that ‘it is a process that is not about ‘representing’ or capturing what is observed but …..coupling the movement of the observer’s attention (haptic, aural etc.) with currents of environmental activity’ Ingold (2000:220). The landscape is experienced is at the point in which it is interpreted or translated between the environment and the person (or group of people). In this way the representation or visualization is no longer a way of objectifying or abstracting the landscape’s characteristics. Instead the experience of the landscape takes place at the point of transition – recognizing the intricate relationship between humans and the natural landscape as a form of ecology. This acknowledges and gives space for an ‘affective’ and ecological perspective on landscapes ‘that can reveal how we are “affected” by environmental settings, and in turn “affect” the way in which we experience and interpret’ the environment (Giaccardi and Foggli 2008: 174).
In the workshop we take the approach of looking at how the landscape ‘affects’ and is ‘affected’ by us. We will explore how multiple affective inputs start to combine together to form a living data ecology, realized in a form of ad-hoc patchwork of inputs and outputs. We will work with a broad range of live user-centred data formats such as GPS traces, social media, location-based images and sensor data. The importance of this patching technique is not in the original data format, but in what happens at the point when it starts to operate as a data ecology and how it becomes ‘patched’ into a changing landscape.
Part one of the workshop participants will be offered a series of ‘input’ technologies that will plug data into the switchboard. This may include GPS data gathered from smart phones, photographs and text developed in response to exploring the local area, and the use of environmental sensors that are able to stream data to the switchboard via the internet. The second part of the workshop will allow participants to explore how to ‘output’ the data by plugging it into different visualization, representation and modeling technologies. This may include use of the Unity 3D game engine, rapid prototyping technologies, storytelling forms and network maps.
We will employ a patching system to switch different inputs and outputs across participants, so that they not only work with data they themselves are creating but also responding to or being ‘affected’ by that being created by other participants. Through the process of transposition, it is hoped that participants will benefit from the rich potentials that digital media offers into transforming from one meaningful form into another. (and an understanding of how they operate within a dynamic ad-hoc patching of environmental representations).
Input Technologies
Comob www.comob.org.uk
Comob is a method of social and spatial mapping. This free software for the iPhone allows groups of people to see each other’s movements represented on screen as circular nodes with lines linking their individual positions (Fig. 1). This data is also sent live to visualisation software that allows observers to see their movement at a distance. Previous projects have mapped and tracked individuals, however Comob proposes that those individual tracks are only part of how we move through space. Use of public space is a social activity, one that we do in relation to other people. Comob allows for observation of how movement through space is a social activity, and proposes that those movements can be used to map relationships to space.
Comob workshops to date (Edinburgh, Manchester, Belfast and Dundee) have used open-ended themes such as pollution, fear and community as a subject to map within a city. These open ended terms are used the are highly contested when identified within actual landscapes, in other words, what is a beautiful part of the landscape to one person, may be pollution to another. During workshop sessions, groups of participants are introduced to the application and briefed with the task of working as a small team to identify areas that correspond with the theme in the local area and demarcate them by forming a Comob ‘shape’ around the area.
Whilst reflecting upon their experiences of using Comob, participants of workshops have described a numbers of experiences that indicate that the software offers particular insights into interpreting the landscape:
1. Using Comob meant that initial assumptions about an abstract concept such as pollution or fear were immediately brought into question. Litter (for example) might seem like a straightforward category to pollution but when a group went out to map it they quickly realised that their assumptions were both confirmed and challenged on the ground. Instead of discussing this at a later date, the software encourages discussion and reflection in action and in situ.
2. Having agreed upon an abstract or non visual subject, Comob encourages people to reflect on their individual perceptions of that subject by asking them to decide where it stops and starts by mapping it with their bodies. By seeing how other people were making these decisions, participants questioned their own decisions about abstract ideas.
3. Comob showed a potential for use in the co-ordination of strategic spatial action. Each participant was able to see the rest of the group and co-ordinate their movements. In offering the overview from within an embedded view group movements can be co-ordinated in new ways.

Fig. 1: iTunes Screen Shot for Comob Net iPhone application allowing groups of people to see each others movements and link their individual positions. Developed by J.Ehnes, H.Ekeus for C. Lowry, W. Mackaness, J. Southern, C. Speed & M. Wright. ©2009
Tales of Things www.talesofthings.com
Tales of Things explores the relationship of personal memories and real world objects (things) and provides, enabled by tagging technologies, a context for sharing of personal and social memories through digital media. Things that are tagged with QR Codes or RFID tags as part of the Tales of Things service become tokens for the access and inscription of memories when they are brought in contact with Tales of Things clients. Tales of Things has been developed to support our research in the ESPRC funded TOTeM (Tales of Things and electronic
Memory) project that cordially runs between five different universities across the UK (Edinburgh College of Art, Brunel University, University College London, The University of Dundee, The University of Salford.
The technical architecture of Tales of Things consists of a web application that provides enabling backend services and different clients (browser, mobile phones, RFID readers) that access this service via different API’s (Application Programming Interfaces). People that register for a free account on the project website can add new objects to a user-generated object database via a web browser interface or in situ using a client on their mobile phone. During this process people are asked to provide (optional) meta-information (e.g. name, keywords, location) and a story (tale) about the object (thing). Tales can be told using text and any additional media that can be referenced via a URL (Unified Resource Locator). The system is capable of analyzing provided URLs and rendering media from services such as YouTube, Flickr and Audioboo in an integrated media player interface.
When a new object (thing) is created the service creates a unique two-dimensional barcode (QR Code) for the object that can be printed out and attached to the object. People are also able to link the objects using RFID tags. The web interface provides additional functions such as a commenting system, display of the location of things and tales on a map, search, creation of groups, user profiles, email and Twitter notifications. Downloadable mobile clients that can read Tales Of Things QR Codes provide additional functions such as a specific format to present the tales and an interface to add new tales when a barcode has been scanned, these are available for the iPhone and Android platform. Other non-project specific QR Code readers can also be used with our tags and will redirect people to the public URL of the object.
The Tales of Things website also offers members the ability to generate blank QR codes that may be printed out and ready to be associated with material. Technically pre-assigned to an instance in the database, the blank QR codes can be scanned by a mobile client and ‘filled’ with content directly from the smart phone. The ability to add a photo, story and keywords means that it is very convenient for users to carry blank codes and attach them to objects as they find them in situ and not have to log into a desktop computer.
Eco-OS http://www.eco-os.org/ (Delivered by Mike Blow and Luke Christison).
Like a matryoshka doll i-DAT’s Operating Systems recursively colapse in on themselves. somewhere the body sits (Bio-OS.org – a body that is neither ill or super fit, simultaneously an individual and a crowd) located in a physical architecture (Arch-OS.org – an operating system for contemporary architecture / software for buildings) framed by a Social network (S-OS.org – where hapiness lies somewhere at the end of a bell curve and true love can be found in a slice of pie chart) and all sitting snugly within a complex ecology (Eco-OS.org – harvesting data from the environment, bringing the landscape a little closer). Through ECO-OS, an ecological Operating System, the manifestation of human and environmental interactions are literally placed in the broader landscape. Eco-OS further develops the networked sensor model of these Operating Systems through the manufacture and distribution of networked environmental sensor devices. Location aware data harvested from across a landscape is transmitted to the Eco-OS server for processing.

Fig. 2: An ecoid in a tree is worth… developed by and deployed in the Confluence Project developed the North Devon Biosphere, Beaford Arts and i-DAT 2011.
Ecoids: are sensor devices (small pods) that can be distributed through an environment (work place, domestic, urban or rural). Based on xbee’s the sensors allow environmental data to be collected from the immediate vicinity. The sensors can be connected together through the formation of Wireless Sensor Networks (mesh and Star) that enable the coverage of an extensive territory. Each ecoid has a unique id and its location within a network can be triangulated giving its exact location. Consequently locative content can be tailored to a specific geographical area. Ecoids can also be used to produce content be receiving instructions from Eco-OS. Distributed performance can then be orchestrated across a large territory through light displays or acoustic renditions. Environmental data from light, temperature, humidity, movement, turbidity and flow, etc can be harvested. Calibration and an agreed/aggregated meaning can then be negotiated.
WiMo: The Technology Probe
WiMo is a smart phone application that enables a way to capture and understand people’s emotional response to places. Unlike direct observation such as is common in usability studies, this field study tool allows participants to self-report their response and actions over a period of time in a fairly naturalistic manner.
The interface is based on a series of three input stages; firstly, the emotional matrix, secondly the definition of the place and finally a text entry screen for a description or note. Once the user has created an emotional tag there are two options for viewing the overview map.
To create an emotional geo-tag at a location the user is first promoted to define the quality of the emotion in the matrix. They tap the screen somewhere within the range of the four axis matrix to select the appropriate emotion. Following this the tag is displayed as a cloud icon overlaid on the real- time position on the map, which the user can customize by defining the approximate area of the cloud so that it matches with the physical extent of the place.
The user then has the option to enter a text description of their response. Once the user submits this description they enter the screen with other user’s emotional tags overlaid on the map. They can then choose to view the tags either as pins or as coloured tags on a map background. The colour represents the type of emotion chosen by the user and the extent the physical are of the location they are describing. The user can click on a pin to view the text description associated with the tag as well as the name of the user that created the tag.
WiMo has been used with participants in a series of casestudies. The findings of these studies show that although expressing emotions is a social activity some people also want to record their emotions in a diary format that would remain private. Generally however the opportunity to view a series of feelings overlaid on the space of the city caused people to reflect on the way they viewed the places of their everyday life and to recognise their affective value. Thus we proposed that not only the expression of feelings but the sharing of these emotional response can support a positive sense of community.
Output Technologies
DataAppeal www.dataappeal.com
DataAppeal Inc is a data analytics and visualization company interested in helping organizations increase the use and sharing of information to improve high-quality decision making. The DataAppealTM platform visually represents geo-referenced raw data into spatial-designed maps, providing an instant and clear understanding of the information. The visual representation of the data allows users to quickly analyze the information and start to draw conclusions from previously hidden trends, areas of interest, and through quick comparisons of results. DataAppealTM, is a web-based application that renders raw location-based data (such as that in spreadsheets) as 3D or animated maps on the Google Earth platform, and the user can actually immerse themselves into their data-map and walk through their data on street view or drill down to the source.
No GIS training is required to use our tool. The user can simply upload a spreadsheet (csv, excel, and shapefiles) and design their data through a palette of visual options. It’s quite intuitive to use. Users typically upload all types of data from various industries and sources. For example, environmentally based data is a popular type of data; we have groups that have uploaded and visualized CO2 levels, smog, and pollution readings. Data regarding primary site-analysis values is another type. We have had landscape architects and students upload assessment value through a matrix data spreadsheet to visualize the site-analysis values along street corridors, river banks, as well as city districts and development sites. They have used our platform to visualize a matrix or scoring value for a given section on the site as part of their SWOT (Strengths, Weaknesses, Opportunities, and Threats) analysis.

Fig. 5: Screen Shot from DataAppeal showing CO2 readings in France. Developed by Dataappeal.com. ©2012.
Some of the data that has been visualized includes: green development infrastructure growth; number of people using a space at a specific time; tree coverage; nightlife activity; cultural venues count; façade beautification, just to name a few.
Typically, the data is collected by the users. Sometimes individuals upload data from open-source data providers such as NYC Open Data, Wellbeing Toronto, and other city-based open-data websites.
DataAppealTM also hosts a community-data-sharing platform, called the “Data Gallery,” which provides a data market on our application for registered users. Members who have uploaded and rendered their maps have the option of posting their data publicly on our platform. Other users are then able to browse, view, and access it to enrich their own maps.
Landscapes architects and urban planners can use the created data-map as a presentation aid to show their clients areas of concern or interest. From here, these maps can be used as an instrumental device to help make better design decisions.
Game Engine: https://i-dat.org/op-sy-2/
Was once the closest the inside got to the outside was through the creeping of floral patterns onto the living room wallpaper. Penetrating the membrane of the conservatory wall the landscape data feeds now seep into a different kind of fantasy world. The domestic consumption and immersive qualities of the game engine enable a different engagement with the landscape out there in here. This is not a ‘Virtual World’ constructed on the screen, but something more akin to an environmental dashboard or an Albertian window, but with a different kind of perspective. Something like standing in the rain looking at your mobile phones weather forecast, it is raining, you are getting wet, but somehow the digital representation doesn’t feel like that.

Fig. 6: Unity 3D environmental data feeds. I-DAT 2012
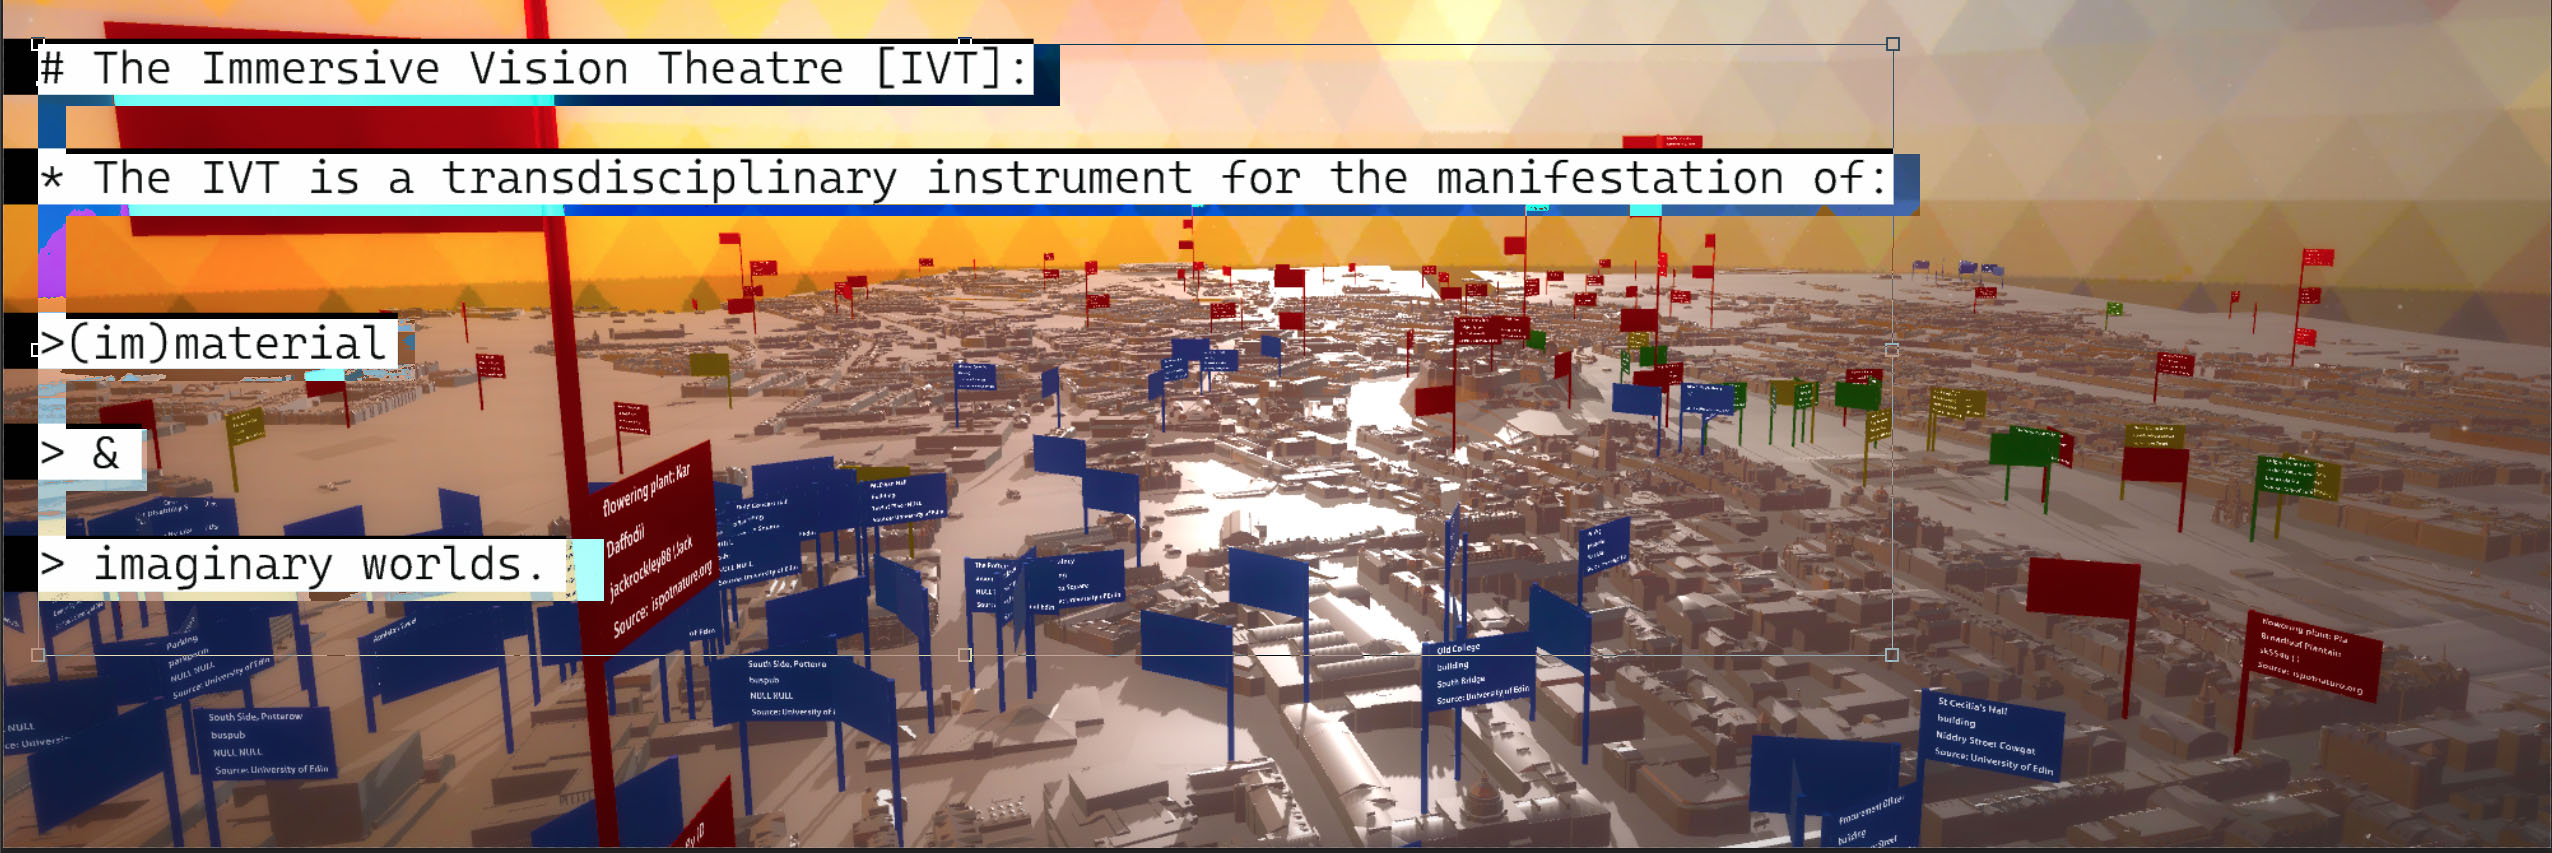
Visualising and sonifying the data harvested from the landscape is an essential component of i-DAT’s Operating Systems. Normally the preoccupation is with FullDome immersive environments (Dome-OS) ), as a transdisciplinary instrument for the manifestation of material, immaterial and imaginary worlds. A credible tool for the rendering of these interactive real-time visualisations is the game engine, in particular Blender and Unity 3D. In this workshop the weapon of choice is Unity 3D mainly because, although not open source, it offers a rapid production pathway. For the FullDome environment the use of a FullDome/Fisheye library is required but here the flat screen representation will be used. Feeds from the Ecoids will be read into the game engine template allowing simple interactions and visualisations. Alternative feeds (xml formatted) can also be incorporated.

Fig. 7: Blender Atomic Force Microscope Data Landscape, i-DAT 2012
3D Printing and Augmented Reality
Technology to create a physical representation of a digital input is increasingly moving into general application. Systems such as the Maker Bot Replicator 2 allow rapid prototyping of objects from industrial design through to household implements. The workshop expands this by capturing the moments in time and space via the inputs for 3D landscapes and augmented reality data visualisation.
The Replicator 2 is arguably the first 3D printer aimed at the non-professional / technology inclined user. The system is able to print almost any shape by extruding layers of heated plastic in an additive process. Creating multiple layers allows a 3D model to be created through the sequential addition of print material, in our case polyactic plastic (PLA). Data collected via the workshop will be transformed firstly into a digital landscape with visualisations via various data engines; the challenge is to move the data collected in the real world back into a physical form while maintaining a level of representation.
Via use of a 3D mesh of the landscape and links back to Unity via the Augmented Reality sdk of Vuforia (https://developer.vuforia.com/resources/sdk/unity) the workshop aims to transform a 3D printed data mesh into an augmented reality view of the event. As a means of recursive representation, the printed landscape represents output from Comob, Tales of Things and Eco-OS. Integrating an agent based modeling approach along with game engine technology, a reel of polyactic plastic and augmented reality offer the possibility to creating a true digital landscape in physical form – a PLA patch scape.
Conclusions and futures
The Patch-scape toolkit of Input and Output technologies offers a system across which data derived from a landscape is parsed and manifested as new material landscapes. Any distinction between quantitative and qualitative collapses, as hard data is transformed in to soft lines, and fuzzy data create solid forms. In reflecting upon the role of information visualisation Lima’s observation hold’s true: “Form doesn’t follow data. Data is incongruent by nature. Form follows a purpose, and in the case of Information Visualisation, Form follows Revelation” (Lima 2009). The possibilities for reconstructing landscapes according to what we would like to reveal are becoming richer. As data sets are broken down to common parts and new technologies are developed to interpret and recast them into different media, we may better understand how other people interpret environments.
(Thrift 2004)
References
Burke, J., Estrin, D., Hansen, M., Parker, A., Ramanathan, N., Reddy, S., and Srivastava, M.B. (2006). Participatory Sensing, paper presented at ACM Sensys 2006, Boulder, Colorado, 2006.
Giaccardi, E., Fogli, D. (2008). Affective Geographies: Toward Richer Cartographic Semantics for the Geospatial Web . International Conference on Advanced Visual Interfaces (AVI 2008). New York: ACM Press, 2008, pp. 173-180.
Harvey, G., Mount, N., Aplin, P., Priestnall, G. (2008). Introduction to Representing, Modeling, And Visualizing The Natural Environment. In : Priestnall, P. Harvey, G., Mount, N., Aplin, P. (Eds.). Representing, Modeling, And Visualizing The Natural Environment. Taylor and Francis.
Ingold, T. (2000). The perception of the environment. Routledge.
Latour, B. (2005) Reassembling the Social: An Introduction to Actor-Network-Theory. Oxford, Oxford University Press.
Leclerc, Y. G., Reddy, M., Iverson, L., Eriksen, M. (2001). The GeoWeb—A New Paradigm for Finding Data on the Web, Proc. ICC2001, Beijing, China, August 2001.
Lima, A. (2009) Weblink: Plotting a critical path. Reflections upon Lima lecture by William Owen:http://madebymany.com/blog/plotting-a-critical-path
MacEachren, A. M. and M. J. Kraak (2001). Research challenges in geovisualization. Cartography and Geography Information Science
Longley, P., Goodchild, M., Maguire, D., Rhind, D. (2006). Geographic Information Systems and Science. John Wiley and Sons
Ratti C., Pulselli R. M., Williams S., and Frenchman D. (2006). Mobile Landscapes: Using Location Data from Cell-Phones for Urban Analysis, Environment and Planning B: Planning and Design, 2006, 33(5): 727–748.
Thrift, N. (2004) Driving in the City. Theory, Culture & Society, Vol. 21, No. 4-5, 41-59.
Turner, M.G., R. H. Gardner and R. V. O’Neill (2001). Landscape Ecology in Theory and Practice. Springer-Verlag, New York, NY, USA.
You must be logged in to post a comment.